

Prerequisites
Make sure to have data samples on your test set, you can add data samples from the Data Acquisition page or the Live Classification page.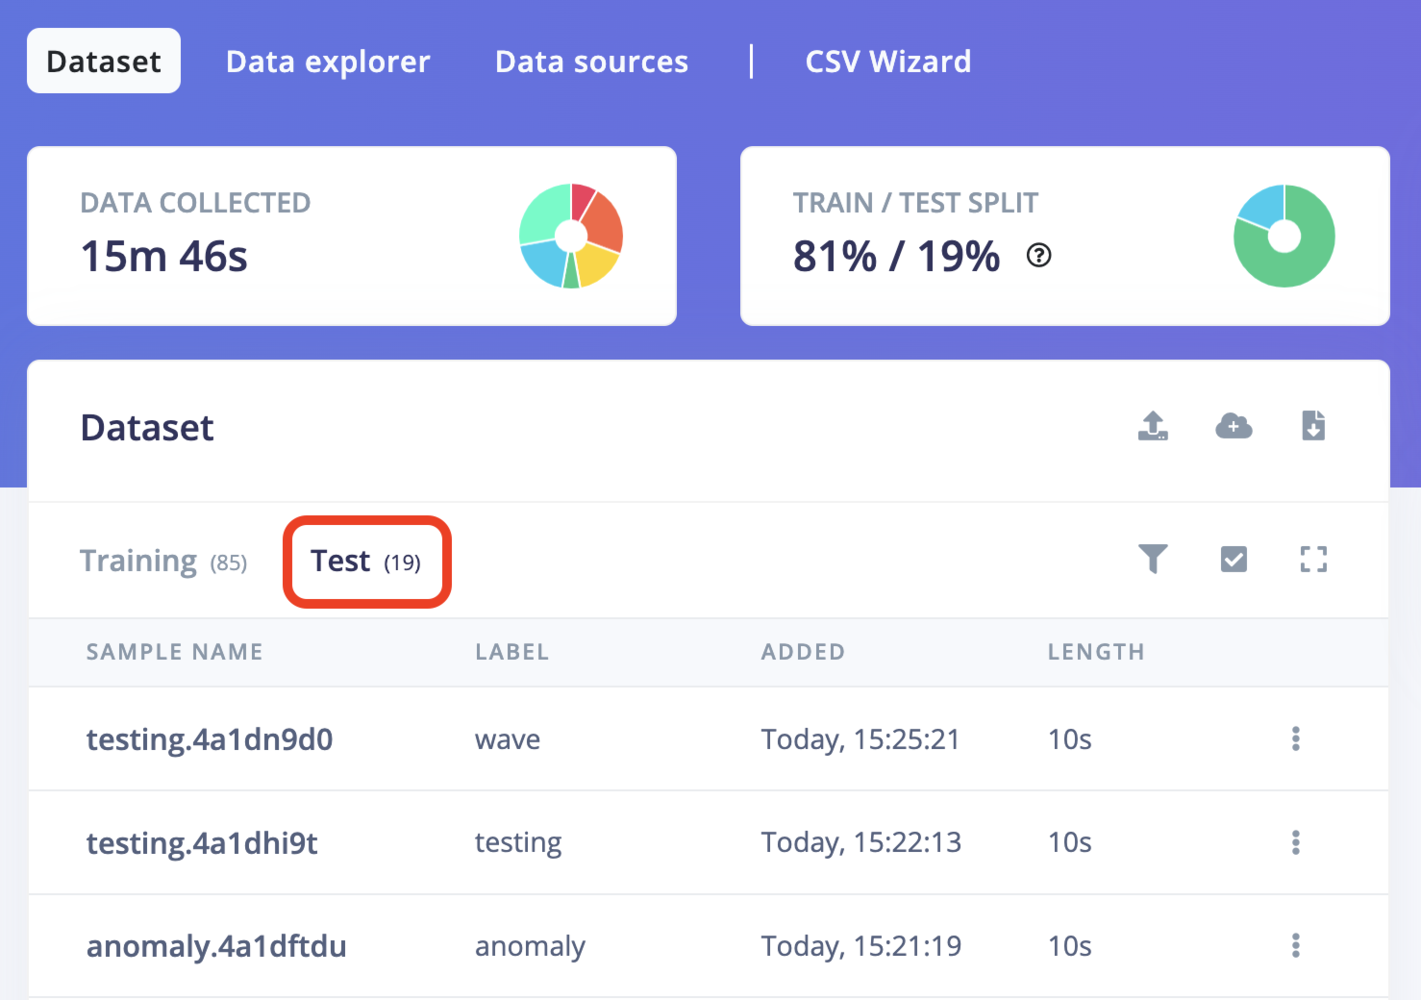
Test dataset
Running a test
To test your model, go to Model testing, select the desired model version from the dropdown (either Unoptimized (float32) or Quantized (int8)), and click Test all. The model will classify all of the test set samples and give you an overall accuracy of how your model performed.Quantized (int8) model is not enabled by default and the fist step of enabling is in the settings menu beside the Classify all button
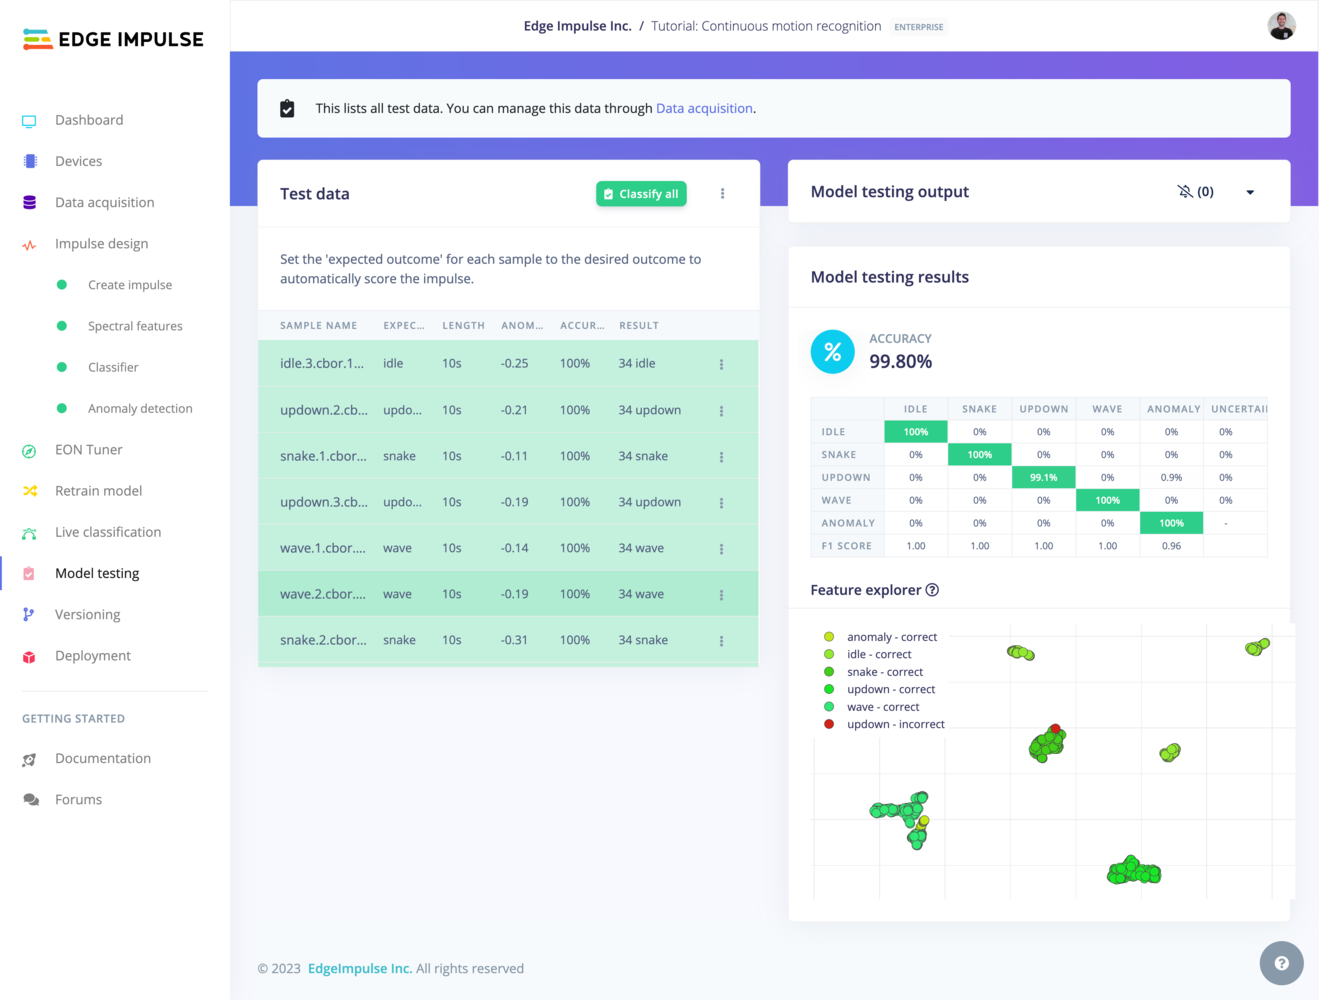
classify all test images
Float32 vs int8 models
You can test your model using either the float32 or int8 quantized version. The float32 version offers higher precision but may use more resources, while the int8 quantized version is optimized for memory and computational efficiency, making it suitable for edge devices with limited resources. Test both variants. Quantization maps weights and activations to 8-bit integers, which usually costs a little accuracy in exchange for a smaller, faster model. Results are stored per variant, so once you have tested both you can switch between them in the dropdown and compare. Test the variant you plan to deploy.Reading the results
Accuracy
The headline accuracy is the share of test samples the model classified correctly: samples classified as their expected label, divided by the total number of samples that counted towards the result. Studio also reports accuracy per class. Check it as well, because a model can be 95% accurate overall but 40% accurate on a rare class. Depending on the project type, additional metrics are reported alongside accuracy, such as a balanced accuracy score for imbalanced datasets, separate anomaly and no-anomaly scores for anomaly detection, an F1 score for object detection, and a mean squared error for regression.Confusion matrix
This is also accompanied by a confusion matrix to show you how your model performs for each class and an interactive feature explorer that lets you click on a sample to easily visualize this dedicated result.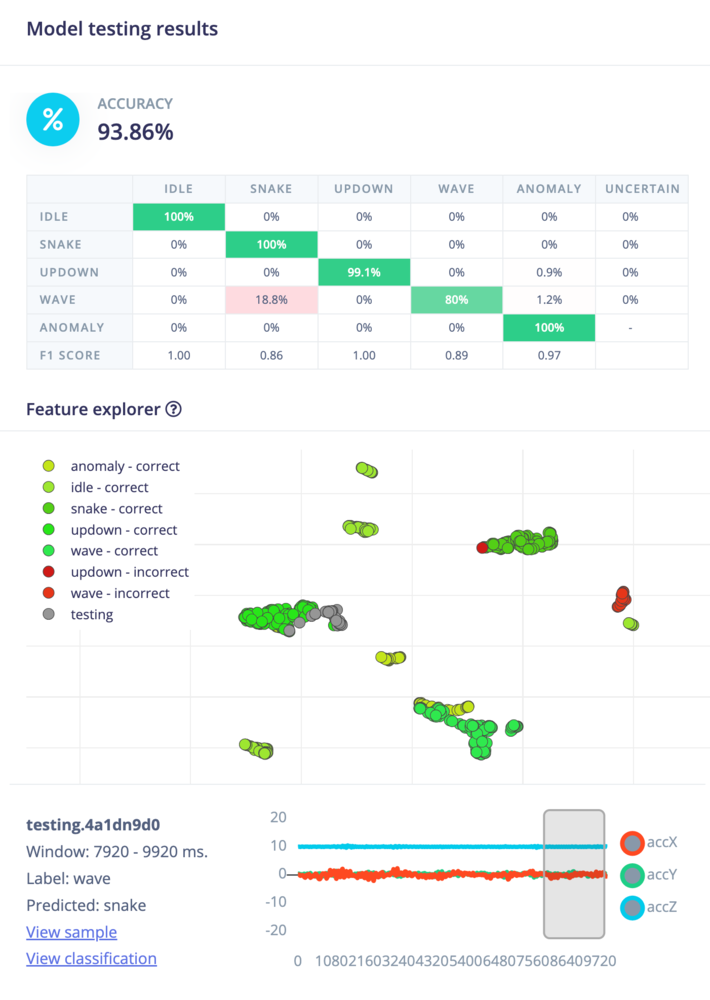
Model testing confusion matrix
The sample table
The model testing data table has some quick actions available for each samples: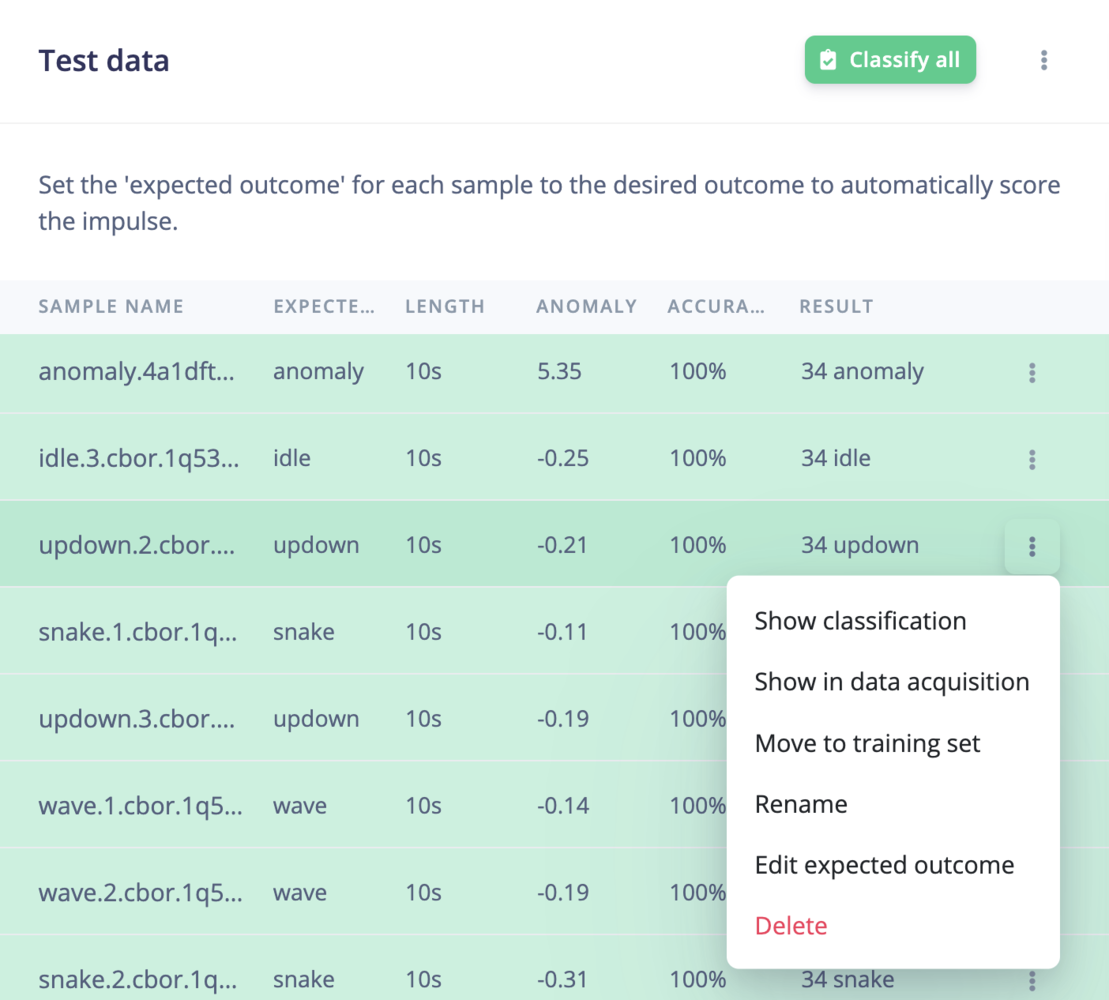
Model testing data table
anomaly for anomaly detection learning blocks are ignored from the accuracy or the F1 score calculation:
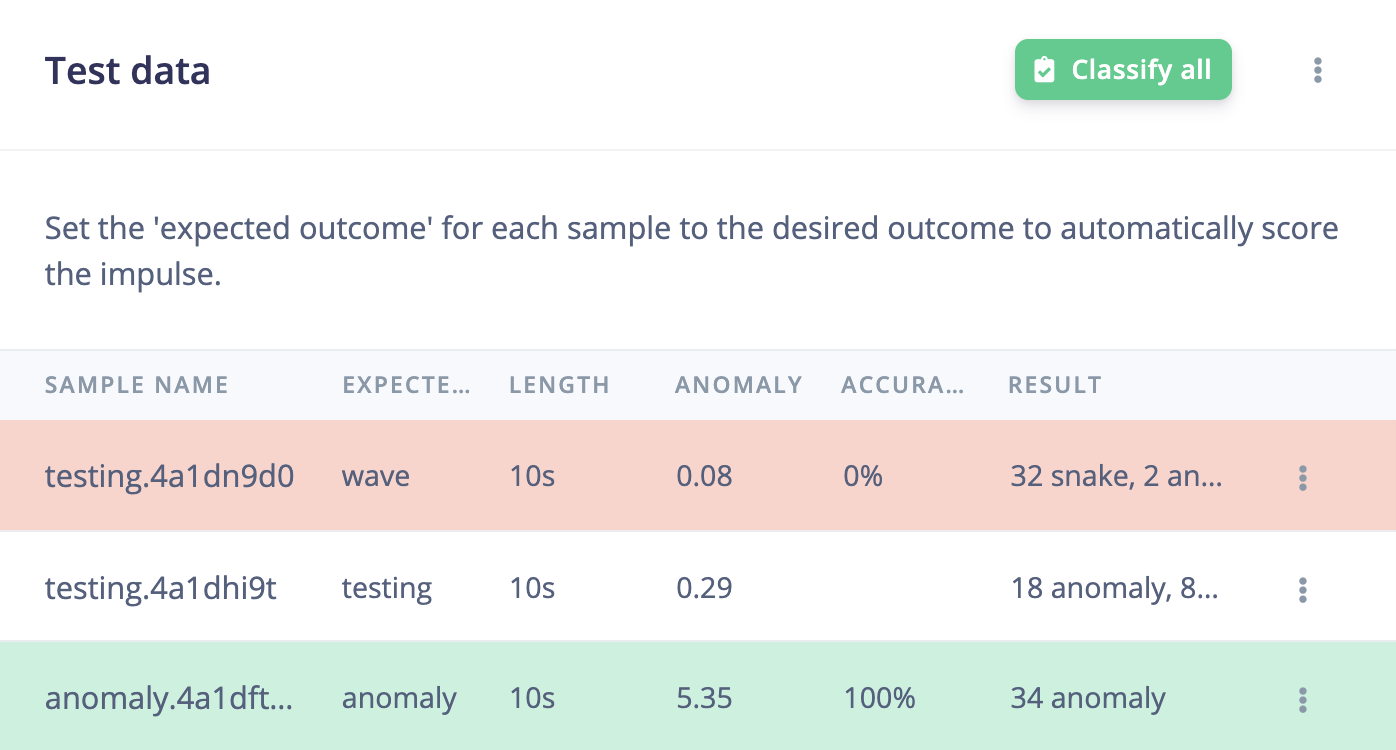
Ignored samples
Setting confidence threshold
Every learning block has a threshold. This can be the minimum confidence that a neural network needs to have, or the maximum anomaly score before a sample is tagged as an anomaly. You can configure these thresholds to tweak the sensitivity of these learning blocks. This affects both live classification and model testing.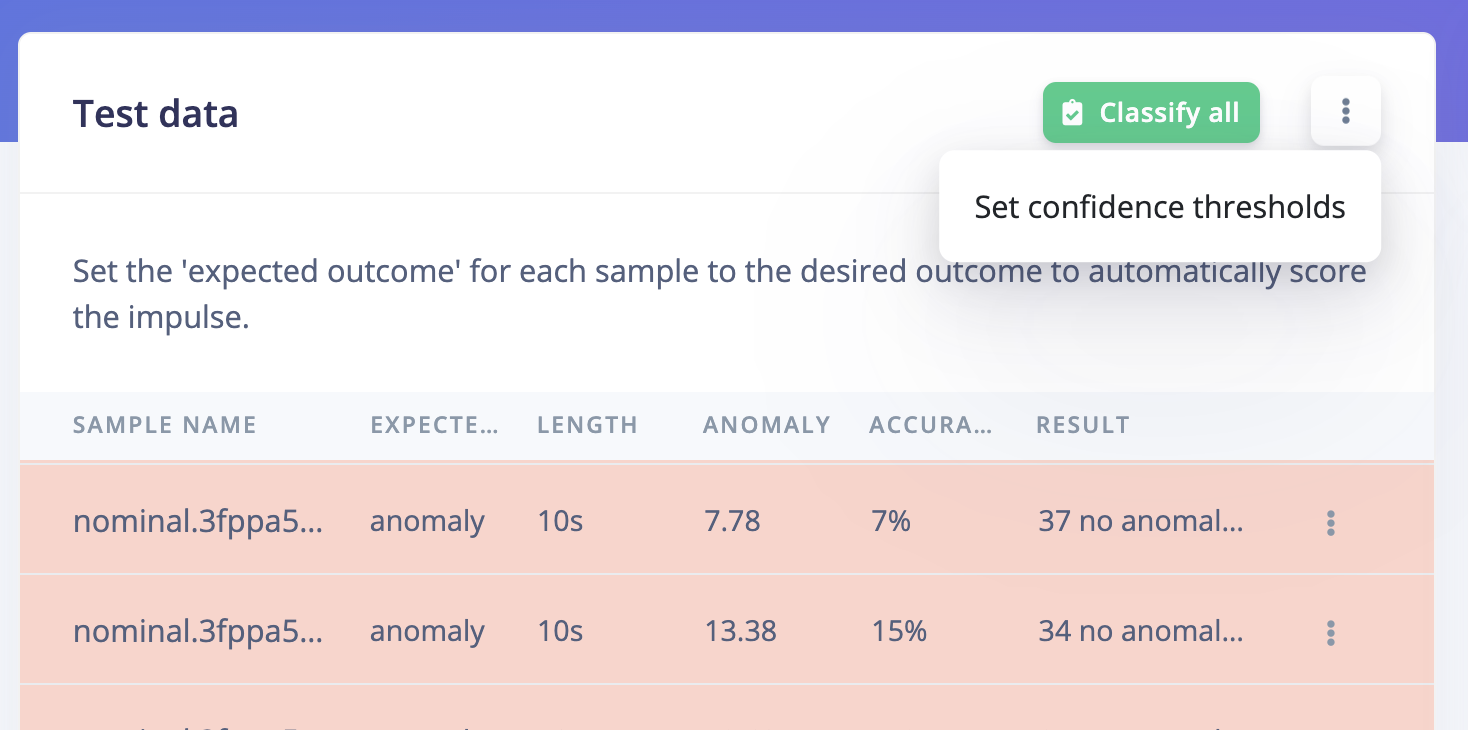
Setting confidence threshold
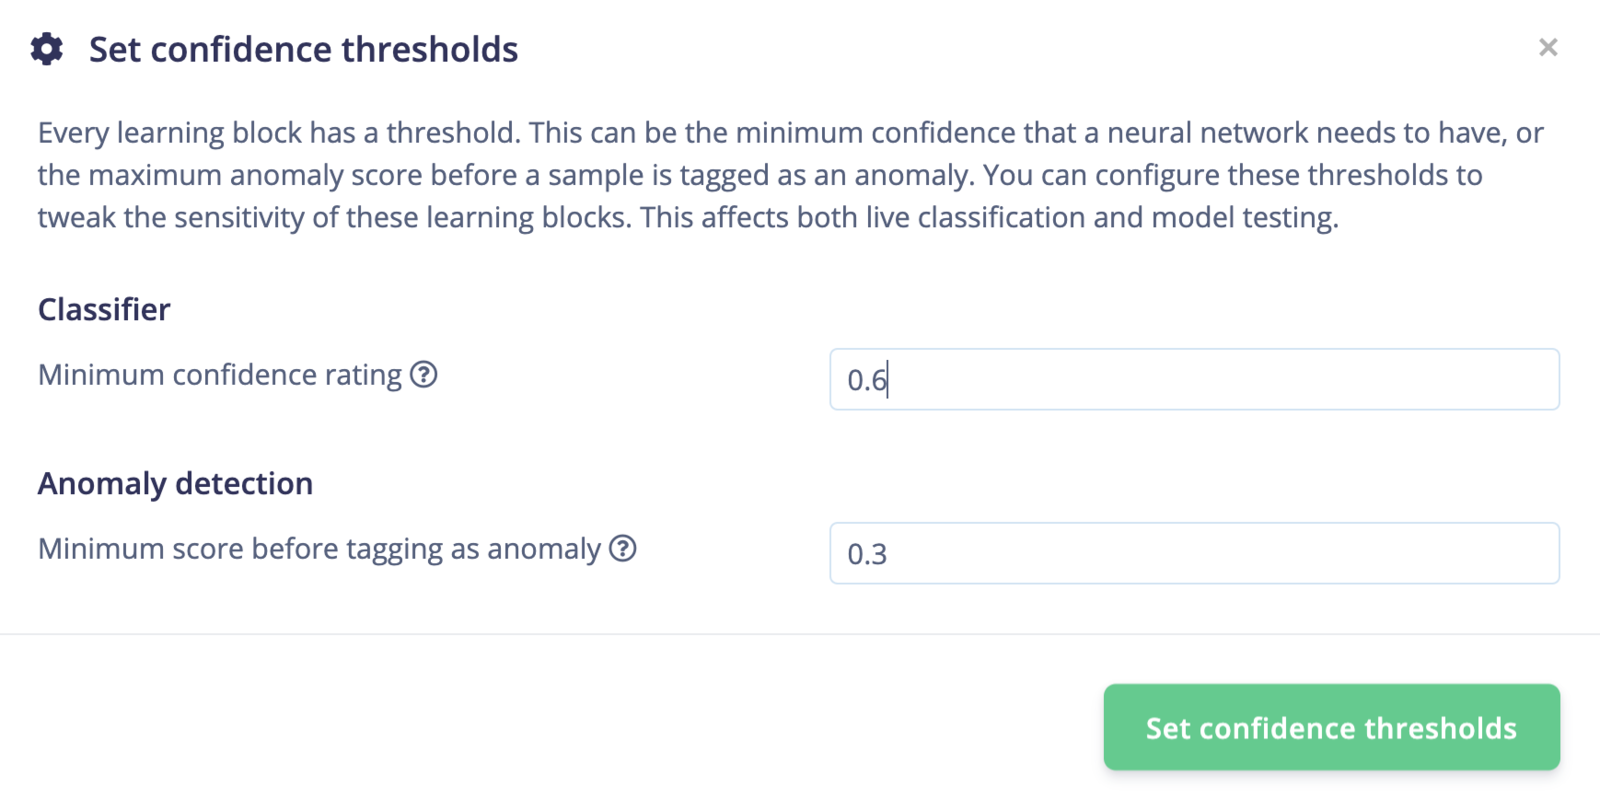
Setting confidence threshold values
Evaluating individual samples
To see a classification in detail, go to the sample you want to evaluate, click the three dots next to it, and select Show classification. A new window shows the expected outcome and the model’s prediction with its accuracy, which can help you see why an item was misclassified.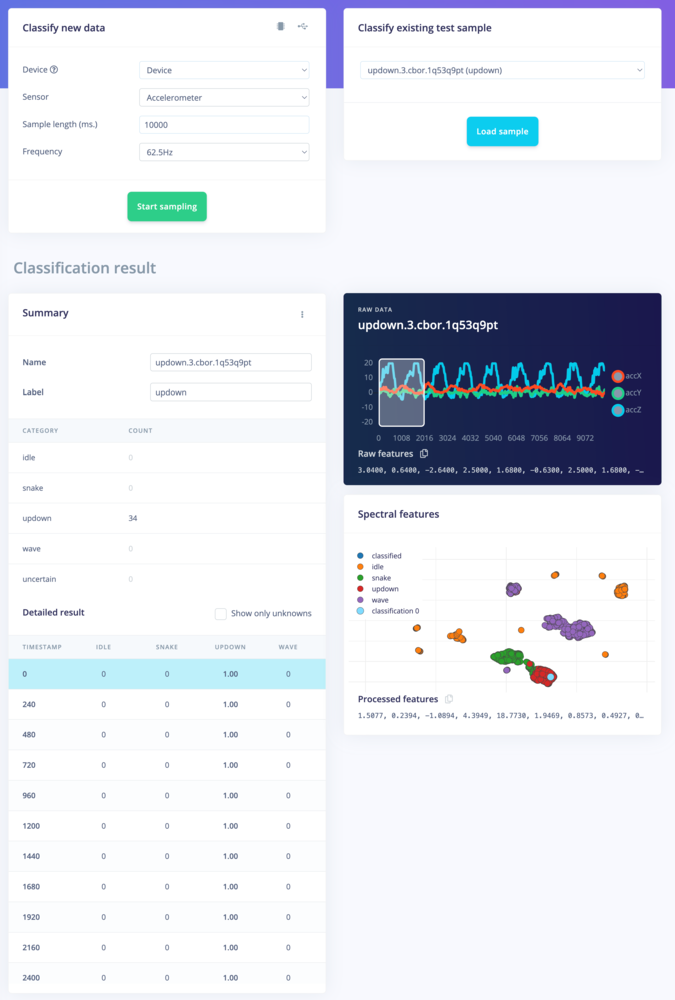
Classification result. Showing the conclusions, the raw data and processed features in one overview.
Testing programmatically
Like the rest of the impulse endpoints, these take an optional
impulseId, so you can test each experiment in a project from a script and collect the results together.